2014年4月22日星期二

Top 3 Salespersons Ranking by Monthly Sales Amount R language VS.esProc

Both R language and esProc have the outstanding ability to perform the stepwise computations. However, in the particulars they differ from each other. A comparison between them will be done by the following example:

A company’s Sales department wants to select out the outstanding salespersons through statistics, that is, the salespersons whose sales amounts are always among the top 3 in each month from the January this year to the previous year. The data is mainly from the order table of MSSQL database: salesOrder, and the main fields include the ID of order: ordered, name of salesperson: name, sales amount: sales, and date of order: salesDate.
The solution is like this substantially:
1.       Compute the beginning dates of this year and this month, and filter the data by date.
2.       Group by month and salesperson, and compute the sales amount of each salesperson in each month.
3.       Group by month, and compute the rankings of sales amount in each group.
4.       Filter out the top 3 salespersons from each group.
5.       Compute the set of intersections of each group, that is, salespersons always among the top 3 in each month.

The solution of R language is as shown below:
01   library(RODBC)
02   odbcDataSources()
03   conn<-odbcConnect("sqlsvr")
04   originalData<-sqlQuery(conn,'select * from salesOrder')
05   odbcClose(conn)
06   starTime<-as.POSIXlt(paste(format(Sys.Date(),'%Y'),'-01-01',sep=''))
07   endTime<-as.POSIXlt(paste(format(Sys.Date(),'%Y'),format(Sys.Date(),'%m'),'01',sep='-'))
08   fTimeData<-subset(originalData,salesDate>=starTime&salesDate<endTime)
09   gNameMonth<-aggregate(fTimeData$sales,list(fTimeData$name,format(fTimeData$salesDate,'%m')),sum)
10   names(gNameMonth)<-c('name','month','monthSales')
11   gNameMonth$rank<- do.call(c, tapply(gNameMonth$monthSales, gNameMonth$month,function(x) rank(-x)) )
12   rData<-subset(gNameMonth,rank<=3)
13   nameList<- split(rData$name, rData$month)
14   Reduce(intersect, nameList)

The solution of esProc is as shown below:


Then, let’s compare the two solutions by checking the database access firstly:
R language solution implements the data access from Line01 to 05 through relatively a few more steps, and this is acceptable considering it as the normal operations.
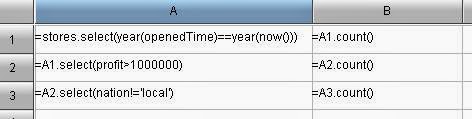
esProc solution allows for directly inputting SQL statements in the cell A1, which is quite convenient.
In respect of database access, R language and esProc differ to each other slightly. Both solutions are convenient.

Secondly, compare the time function:
R language solution computes the beginning dates of this year and this month through line 06-07. Judging from this point, R language is abundant in the basic functions.

esProc solution completes the same computation in A2 and B2, in which pdate function can be used to compute the beginning date of this month directly, which is very convenient.

In respect of date function, it seems that esProc is slightly better, while R language has a huge amount of 3rd-party-function library, and maybe there is any date function that is easier to use.

The focal point is stepwise computation:
Firstly, filter by date, group by month and sales person and then summarize by sales amount. The above functionalities are implemented respectively in line 8-9 for R language and cell A3-A4 for esProc. The difference is not great.

Proceed with the computation. According to the a bit straightforward thought of analysis, the steps followed should be: 1 Group by month; 2 Add the field of ranking in the group, and compute the rankings; 3 Filter by ranking, and only keep the salespersons that achieved the sales amounts ranking the top 3 in each group; 4. Finally, compute the set of intersection on the basis of the data in each group.

The corresponding codes of R language are from line 10 – 14 in the order of 2->3->1->4. In order words, rank the data in each group throughout the whole table, and then group. Have you noticed anything awkward? Although it is the ranking within the group, users of R language have to sort first and then group! This is because R language is weak in the ability to group first and then process. To barely compose the statements following the train of thought of 1->2->3->4, users of R language must have a strong technical background to handle the complex iteration statement expressions. The style of reverse thinking on this condition will greatly simplify the codes.

esProc solution completes the similar computation in the cell A5 – A8, not requiring any reverse thought. esProc users can simply follow their intuitive thinking of 1->2->3->4. This is because that esProc provides the ingenious representing style of ~. The ~ represents the current member that takes part in the computation. For this case, the ~ is each 2-dimension table in the group (corresponds to the data.frame of R language or the resutSet of SQL). In this way, ~.monthSales can be used to represent a certain column of the current 2-dimension table. By compassion, users of R language can only resort to some rather complicated means like loops to access the current member, which is more troublesome for sure.

With regard to this comparison, esProc is more intuitive with relatively more advantageous.

Next, let’s study on their abilities in computing the intermediate results.
R language allows users to view the result of each step by clicking the variable name at any time, with RStudio and other tools.
esProc provides only one official tool, that is, click the cell to view the result of this step.

Regarding this ability, esProc does not differ from R language much. Considering that R language supports for a great many of 3rd party tools, maybe there is any tool capable of providing the better observed results.

Then, let compare their abilities to reference the result.
R language users are only required to define a variable for the result of computation in each step to conveniently reference the result in the steps followed with regard to the R language solution.

esProc users can also define variables to reference, however, using the cell name as the variable name is more convenient and saves the trouble of finding a meaningful name.

Next, let’s compare their performances on set of intersection.
In the last step, the intersection set of data of every group are to be computed. R language provides the intersect function at the bottom layer, using together with Reduce function, the intersection set of multiple groups of data can be computed.

esProc provides isect function to compute the set of intersection on multiple sets, which is quite convenient.

Comparatively, R language provides the Reduce function of greater imaginary space, and esProc is easier.
As it can be seen from the above case, R language boasts the abundant fundamental functions and a huge amount of library functions from the 3rd party.

In respect of data member access, esProc provides the excellent representing style, in particular the grouping at multi-levels. By comparison, R language relies more on the loop statements.

Both esProc and R language solutions have excellent performances in respect of interaction.


2014年4月17日星期四

Solving a JOIN Computation by SQL and esProc

Based on the generic data type, esProc provides the sequence and the Table Sequence for implementing the complete set-lizing and the much more convenient relational queries.

The relation between the department and the employee is one-to-many and that between the employee and the SSN (Social Security Number) is one-to-one. Everything is related to everything else in the world. The relational query is the access to relational dataset with the mathematical linguistics. Thanks to the associated query, the relational database (RDBMS) is extensively adopted.
I Case and Comparison
Case
There is a telecommunications enterprise that needs to perform this analysis: to find out the annual outstanding employees whose line manager having been awarded the president honor. The data are from two tables: the first is the department table mainly consisting of deptName and manager fields; and the second is the employee table mainly consisting of the empName, empHonor, and empDept fields;

For empHonor, three kinds of values can be obtained: First, null value; Second, ”president's award” and PA for short; Third, ”employee of the year” and EOY for short; The corresponding relations are usually belong to either of the two below groups: empDept & deptName, and Manager & empName.

SQL Solution
SELECT A.* 
FROM employee A,department B,employee C 
WHERE A.empDept=B.deptName AND B.manager=C.empName AND A.empHonor=‘EOY’ AND C.empHornor=‘PA’

Complex SQL JOIN query can be used to solve such problems. In this case, we choose the nested query that is brief and clear. The association statements after “where” have established one-to-many relation between deptName and empDept, and the one-to-one relation between manager and empName.

esProc Solution
employee.select(empHonor:"EOY",empDept.manager.empHornor:"PA")

The esProc solution is quite intuitive: select the employees with EOY on condition that the line respective managers of these employees have won the “PA”.

Comparison
Regarding the SQL solution, the SQL statements is lengthy and not intuitive. Actually, the complete associated query statement is “inner join…on…”. We have put it in a rather simplified way or the statements would be even harder to comprehend.

Regarding the esProc solution, the esProc fields are of generic type, which can point to any data and dataset. Therefore, you can simply use ”.” symbol to access the associated table directly. By representing in such intuitive and easy-to-understand way, esProc users can convert the complicated and lengthy SQL statement for multiple table association to the simple object access. This is unachievable if using SQL.

II Function Description:
Generic Data Type

The data in esProc are all of generic type, that is, the data types are not strictly distinguished. Therefore, a data can be a simple data like “1” or “PA” ,or a set like [1,” PA”], or a set composed of sets like the database records.
Sequence


A sequence is a data structure specially designed for the mass data analysis. It is similar to the concept of “array + set” in the senior language. That is to say, esProc users can assess members of any type according to its serial number, and perform the intersection, union, and complementary set operations on these members. The sequence is characterized with two outstanding features: generic type, and being ordered.

For example, let’s suppose that the sequence A is a set of line managers, and the sequence B is a set of award-winning employees. Then, the award-winning departments can be computed as a result of A^B. The top three departments can be obtained as a result of [1,2,3] (Please refer to other documents for the characteristics of being ordered).

esProc provides a great many of easy-to-use functions for sequence. The analysis will be greatly simplified if you grasped the use of sequence well.
Table Sequence
The Table Sequence is a sequence of database structure. As a sequence, it is characterized by being generic and ordered. In addition, Table Sequence also inherited the concept of database table that allows for the access to data with the field and the record.


The characteristics of generic type allow for the associated query in a quite convenient way in which the access to the record of associated table is just like the access to object. For example, to access the line manager of a certain employee, you can just compose “empDept.manager”. By comparison, the counterpart SQL syntax requires quite lots of wieldy association statements: “from…where…” or “left outer/right outer/inner join…on…”

Moreover, the characteristics of being ordered are quite useful and convenient for solving the tough computational problems relating to the Table Sequence and serial numbers, such as computing the top N, year-on-year statistics, and link relative ratio analysis.
III Advantages
The Access Syntax to Convert Complexity to Simplicity
esProc users can use ”.” to access the record in the associated table. Compared with the lengthy and complicated association syntax of SQL, such access method and style is much easier.

Intuitive Analysis is Ideal for Business Specialist
Analyzing from the business aspect, the business specialist can reach the result more correctly and rapidly. esProc users can access to the associated data in an intuitive way following the business descriptions and thus it is ideal for business specialist.

Easy to Analyze and Solve Problem
The sequence and table sequence of esProc is fit for processing the mass data. Even for the complicated multiple-table association, esProc users can solve the problems conveniently in the process of data analysis.

About esProc: http://www.raqsoft.com/product-esproc

2014年4月15日星期二

Simple Inter-row Computation R Language VS esProc

The inter row computation is quite common, such as the aggregate, comparison with same period of any previous year, and link relative ratio. Both R language and esProc provides the pretty good inter-row computation ability with slight difference to each other. In the below case, the utilization of some basic inter-row computations is demonstrated to study on the differences between the two methods:

A sales department of a company wants to make statistics on the outstanding sales persons, that is, the sales persons achieve half of the total sales of the company. The data are mainly from the order table of MSSQL database salesOrder. The main fields include the ID of order: ordered, Name of sales person: name, Sales amount: sales, and date of order: salesDate.
The straightforward solution is as shown below:
1.Group by sales person to calculate the sales amount of each sales person.
2.Sort by sales amount in reverse order on the basis of the data from the previous step.
3.According to the previous step, calculate the aggregate value of each record, and calculate the standard of comparison: the half of total sales of this company.
4.Of the aggregate values calculated in the previous step, select out the list of sales persons whose sales achievement meet the below conditions: lower or equal to the standard of comparison; or although higher than the standard of comparison, the sales achievement of previous sales person is lower than the standard of comparison.

The detailed solution of R language is as shown below:
01 library(RODBC)
02 odbcDataSources()
03 conn<-odbcConnect("sqlsvr")
04 originalData<-sqlQuery(conn,'select * from salesOrder')
05 odbcClose(conn)
06 nameSum<-gNameMonth<-aggregate(originalData$sales,list(originalData$name),sum)
07 names(nameSum)<-c('name','salesSum')
08 orderData<-nameSum[rev(order(nameSum$salesSum)),]
09 halfSum<-sum(orderData$salesSum)/2
10 orderData$addup<-cumsum(orderData$salesSum)
11 subset(orderData,addup<=halfSum | (addup>halfSum& c(0,addup[-length(addup)])<halfSum))
Please find the detailed solution of esProc below:


Then, let us study on the differences between aggregate values:
The R language uses cumsum to compute the aggregate value in the line 10.
esProc uses cumulate in A4 to calculate the aggregate value.
Both writing styles are very convenient for users. However, the operation principle of esProc is aimed to each record: firstly, calculate the cumulate, then, get the aggregate value corresponding to this record according to the #row number. By comparison, R language enjoys a higher efficiency than esProc on this respect since the computation will be only carried out once if using R language.

Dividing one statement of esProc into two statements can solve the efficiency issue, that is, firstly, calculate the list of aggregate value separately, and then insert it to the original data set. However, such writing style is not as concise as the R language that only requires one line of code.

Then, let us check the qualified sales person and the differences:

The R language completes the computation at the Line 11, mainly by moving the line, and using c(0,addup[-length(addup)])to construct a column for the new data. Compared with the column addup, the new column just moves down one column, and the last entry of data is removed and filled with 0 of the first entry. Then, you can compare whether the aggregate value is lower than the standard of comparison, or although it is higher than the standard of comparison, its previous record is lower than the standard.

The R language does not provide the ability to access the data at the relative position. Therefore, the method of “move the data in the relative position to the current position” is adopted. Though the result is still the same, the style of writing is not intuitive enough, and it requires the analyst a relatively higher ability in logic thinking.

The writing style of esProc is select(addup<=B3 || (addup>B3 &&addup[-1]<B3)). Simple and clear indeed! This is the expression of relative position featured by esProc. Users can use the method of [-1] to represent the record in a position one record before or several records after the current record. For example, the aggregation value calculation in A4 can also be rewritten to A3.derive(addup[-1]+salesSum:addup).

Unlike the fixed algorithm of aggregate value, the algorithm of this step is relatively much freer. You may find that the style of expression regarding the relative position of esProc is very agile with great advantages.
Compared with the fixed algorithms, this step of algorithm is much freer.

As we can see from the above case, the computations of relative position and inter-row computations can solve many problems which are apparently complex. esProc is more flexible in expressing the relative positions. Therefore, esProc users can feel more relax when calculating the complex problems.

Regarding the R language, appending to the whole column/row and the fixed algorithm are relative more concise.

About esProc: http://www.raqsoft.com/product-esproc

2014年4月14日星期一

The More Convenient Data Computing Script

Database plays an irreplaceable role in the modern economy and is widely used in the business computing areas like Enterprise Resources Planning (ERP), Customer Relation Management (CRM), Supply Chain Management (SCM), and the Decision Support System (DSS).

Computation of structured data in the database mainly relies on SQL (Structured Query Language). SQL is the powerful, simple-to-use, and widely-applied database computing script. However, it has some native drawbacks: non-stepwise computation, incomplete set-lization, and no object reference available. Although almost all vendors have introduced and launched some non-compatible solution, such as various stored procedure like PL-SQL, T-SQL. These improved alternatives cannot remedy the native SQL drawbacks.

esProc solves these drawbacks with more powerful computational capability, much lower technical requirement, and broader scope of application. It is a more convenient database computing scripts.
Case Description

A multinational retail enterprise needs to collect statistics on the newly opened retail store, including: How many new retail stores will open in this year? Of which how many companies have the sales over 1 million dollars? Among these companies with over-1-million sales, how many companies are abased overseas?

This question is progressive. The three questions are mutually related, the next question can be regarded as the further exploring on the current question, fit for step-by-step computation.

The original data is from the database of stores table with the main fields: storeCode, storeName, openedTime, profit, and nation. Let's check the SQL solution first.

SQL Solution
To solve such problem with SQL, you will need to write 3 SQL statements as given below.
l  SELECT COUNT(*) FROM stores WHERE to_char (openedTime, 'yyyy')  =  to_char (sysdate,'yyyy');
l  SELECT COUNT(*) FROM stores WHERE to_char (openedTime, 'yyyy')  =  to_char (sysdate,'yyyy') and profit>1000000;
l  SELECT COUNT(*) FROM stores WHERE to_char (openedTime, 'yyyy')  =  to_char (sysdate,'yyyy') and profit>1000000 and nation<>’local’;
SQL1:Get the result of question 1.

SQL2:Solve the problem 2.Because the step-by-step computation is impossible (that is, the results of previous computation cannot be utilized), you can only solve and take it as an individual problem.
SQL3: Solve the problem 3,and you are not allowed to compute in steps either.

esProc Solution


A1 cell: Get the records requested in problem 1.
A2 cell: Step-by-step computation. Operate on the basis of cell A1, and get the record meeting the conditions of problem 2.
A3 cell: Proceed with the step-by-step computation, and get the records requested in the problem 3.
B1, B2, and B3 cell: It is still the step-by-step computation. Count the corresponding records.

Comparison
For the SQL, there are 3 associations for you to compute in steps, and explore progressively. However, because step-by-step computation is hard to implement with SQL, this problem has to be divided into 3 individual problems.

esProc is to compute in steps following the natural habit of thinking: Decompose the general objective into several simple objective; Solve every small objective step by step; and ultimately complete the final objective.

In case that you proceed with the computation on the basis of the original 3 problems, for example, seek "proportion of problem 3 taken in the problem 2", or "on" problem 3, group by country". As for esProc users, they can simply write ”=A3/A2”, and ”A3.group(nation)”. In each step, there is a brief and clear expression of highly readable, without any requirements on a strong technical background. By comparison, SQL requires redesigning the statement. The redesigned statement will undoubtedly become more and more complex and longer. Such job can only be left to those who have the advanced technical ability in SQL.

esProc can decompose the complex problem into simple computation procedure based on the descriptions from the business perceptive. This is just the advantage of the step-by-step computation. By comparison, SQL does not allow for computation by step or problem decomposition, and thus it is against the scientific methodology, and not fit for the complex computation.
Complete Set-lization
Case Description
A certain advertisement agency needs to compute the clients whose annual sales values are among the top 10.

The data are from the sales table, which records the annual sales value of each client with the fields like customer, time, and amount.

SQL solution
SELECT customer
FROM (
    SELECT customer
    FROM (
         SELECT customer,RANK() OVER(PARTITION BY time ORDER BY amount DESC) rankorder 
         FROM  sales ) 
    WHERE rankorder<=10) 
GROUP BY customer
HAVING COUNT(*)=(SELECT COUNT(DISTINCT time) FROM sales)
Such Problem requires ranking the sets of a set, that is, group by “time” and then rank by “customer” in the group. Since the popular SQL-92 syntax is still hard to represent this, the SQL-2003 standard, which is gradually supported by several vendors, will be used to solve this problem barely.

Just a tip to compute the customer intersections in the last step, the count of years equals to the count of clients.

esProc Solution


A1: Group the original dataset by year so that A1 will become a set of sets.
B1: Get the serial number of records whose sales values are among the top 10 of each group. The rank() is used to rank in every group, and pselect() can be used to retrieve the serial number on conditions. ~ is used to represent every member in the set. B1 is the “set of set”.
A2: Retrieve the record from A1 according to the serial number stored in B2, and get the customer field of the record.
A3: Compute the intersection of sets.

Comparison

The SQL set-lization is incomplete and can only be used to represent the simple result set. Developers cannot use SQL to represent the concept of “set of set”. Only the queries of 3-level-nested-loops are available to barely perform the similar computations. In addition, SQL cannot be used to perform the intersection operation easily that developers with advanced techniques can only resort to the unreadable statements to perform the similar operations, such as “count of years equal to the count of clients”. It equals to compute the intersection of client sets.
The set is the base of massive data. esProc can achieve set-lization completely, represent the set, member, and other related generic or object reference conveniently, and perform the set operations easily, such as intersection, complement, and union.

When analyzing the set-related data, esProc can greatly reduce the computation complexity. By taking the advantage of set, esProc can solve many problems agilely and easily that are hard to solve with SQL.

Case Description
Suppose that a telecommunication equipment manufacturer needs to compute the monthly link relative ratio of sales value (i.e. the increase percent of sales value of each month compared with that of the previous month). The sales data is stored in the sales table with the main fields including salesMonth, and salesAmount.

SQL solution
select salesAmount, salesMonth,
        (case when
prev_price !=0 then ((salesAmount)/prev_price)-1
else 0
end) compValue
from (select salesMonth, salesAmount,
lag(salesAmount,1,0) over(order by salesMonth) prev_price
from sales) t

The popular SQL-92 has not introduced the concept of serial number, which adds many difficulties to the computation. Considering this, the designer of SQL-2003 has partly remedied this drawback. For example, the window function lag() is used to retrieve the next record in this example.
In addition, in the above statement, the “case when” statement is used to avoid the error of division by zero on the first record.

esProc Solution
sales.derive(salesAmount / salesAmount [-1]-1: compValue)

The derive() is an esProc function to insert the newly computed column to the existing data. The new column is compValue by name, and the algorithm is “(Sales value of this month/Sales value of previous month)-1”. The “[n]” is used to indicate the relative position, and so [-1] is to represent the data of the previous month.

On the other hand, for the data of the first record, the additional procedure for division by zero is not required in esProc.

Comparison
From the above example, even if using SQL-2003, the solution to such problem is lengthy and complex, while the esProc solution is simple and clear owing to its support for the ordered set.

Moreover, SQL-2003 only provides the extremely limited computation capability. For example, esProc user can simply use the ”{startPosition,endPosition}” to represent the seeking of a range, and simply use ”(-1)” to represent the seeking of the last record. Regarding the similar functionality, it will be much harder for SQL user to implement.

In the practical data analysis, a great many of complex computations are related to the order of data. SQL users are unable to handle such type of computations as easily as esProc users because SQL lacks of the concept of Being Ordered.

An insurance enterprise has the below analysis demands: to pick out the annual outstanding employees (Employee of the Year) whose Department Manager has been awarded with the President Honor. The data are distributed in two tables: department table (main fields are deptName, and manager), and employee table (main fields are empName, empHonor, and empDept).

empHonor has three types of values: null value; ”president's award”, PA for short; and ”employee of the year”, EOY for short. There are 2 groups of correspondence relations: empDept and deptName, and Manager and empName.

SQL solution
SELECT A.* 
FROM employee A,department B,employee C 
WHERE A.empDept=B.deptName AND B.manager=C.empName AND A.empHonor=EOY AND C.empHornor=PA

SQL users can use the nested query or associated query to solve such kind of problems. In this case, we choose the association query that is both concise and clear. The association statement behind the “where” has established the one-to-many relation between deptName and empDept, and the one-to-one relation between manager and empName.

esProc Solution

   employee.select(empHonor:"EOY",empDept.manager.empHornor:"PA")

esProc solution is intuitive: select the employee of “EOY” whose Department Manager has be awarded with “PA”.

Comparison
The SQL statement to solve such kind of question is lengthy and not intuitive. In fact, the complete association query language is “inner join…on…” style. This statement is simplified in the above example. Otherwise it will be much hard to understand.

esProc users can use ”.” for object reference. Such style is intuitive and easy to understand. The complex and lengthy association statement for multiple tables can thus be converted to the simple object access, which is unachievable for SQL. When there are more and more tables, the complexity of SQL association query will rise in geometric series. By comparison, the esProc user can always access the data intuitively and easily by taking the advantage of object reference.

Regarding the multi-table associations of complex computation, esProc can handle it more intuitively and conveniently than SQL.

From the comparison of the above four examples, we can see that esProc is not only characterized with step-by-step computation, complete set-lization, sorted sets, and object reference. The analysis style is intuitive, the syntax style is agile, and the function is powerful. esProc is a tool especially designed for mass data computation, and a more convenient database computing script.

About esProc: http://www.raqsoft.com/product-esproc

2014年4月10日星期四

Tap Utmost Value of Excel

Excel is the most widely-used spreadsheet tool. The nontechnical persons love to use it for computation and analysis though, they usually find the formulas and functions available in Excel are rather poor and the VBA is just double Dutch to them for further analysis. Thus, a huge volume of data with valuable information has been wasted in vain.

esProc is introduced to better the situation. Empowered esProc users can tap the utmost value of Excel® by taking the esProc advantages of powerful computation ability, agile and easy-to-use analysis style, and programmed running mode.

I Case and Comparison
Description
In an advisement agency, a Sales Director receives Client Reports from eight Regional Account Managers by every quarter. The Client Report is an Excel spreadsheet, mainly comprising the client, sales value, and other information about the respective region, as given in the below figure:  


Suppose that the Sales Director wants to compare the big client across various regions. For example, regarding the client of whom the sales value ranks top 10%, 20% or 30%, what’s the average sales, and which enterprise is among the Top 500?

First, let’s have a look at the attempt to solve it with Excel formulas.
Excel® Formula Solution

The first step is to compute the average sales of clients whose sales values rank top 10%. We may adopt the following procedure: firstly, sort the sales value in descending order, and then use count( ) function to compute the total number of clients. Secondly, multiple the total number by 10%, and round the result to get the row number with the round ( ) function. Finally, copy these clients onto a new spreadsheet, and compute the average value. This procedure is not difficult for those who are familiar with Excel®.

Then, let’s proceed with this computation: How many of these big clients are among Top 500? To solve the problem, you need to get the intersection of the two datasets. In other words, this is to compute the common part of big client set and the Top 500 list from the previous step. The computational expression is:
=INDEX(A:A,SMALL(IF(COUNTIF($B$2:$B$15,$A$2:$A$20),ROW($A$2:$A$20),4^8),ROW(A1)))&"

Since the above formula requires 5 various combinations of functions, it is a great challenge to compose it.

To make it worse, the computational procedure of Excel requires the user to carry out manually and only acceptable for the specific Excel spreadsheet. This is not as universal as a program, for example, if program, the whole computational procedure will rerun automatically on receiving different file names. In this case, there are 8 Excel files. Excel users will have to run the computational procedures for 8 times. Moreover, there are 3 rankings: 10%, 20%, and 30%, which means the computation will have to be repeated for 8X3=24 times.

It is obvious that it is too tough to solve this problem with Excel formula.

Let’s try VBA, the most powerful extension tool of Excel.

Excel VBA Solution
Function Collection(a As Range, b As Range)
On Error Resume Next
    Dim arr1(), arr2(), times, tmpindex
    Set newcoll = CreateObject("Scripting.Dictionary")
    With Application.WorksheetFunction
        arr1 = .Transpose(a.Value)
        arr2 = .Transpose(b.Value)
        Do
            times = .Mode(arr1, arr2)
            If IsEmpty(times) Then
                Exit Do
            Else
                newcoll.Add times, Empty
                tmpindex = .Match(times, arr1, 0)
                arr1(tmpindex) = arr1(UBound(arr1))
                If UBound(arr1) = 1 Then
                    arr1(1) = Empty
                Else
                    ReDim Preserve arr1(1 To UBound(arr1) - 1)
                End If
                tmpindex = .Match(times, arr2, 0)
                arr2(tmpindex) = arr2(UBound(arr2))
                If UBound(arr2) = 1 Then
                    arr2(1) = Empty
                Else
                    ReDim Preserve arr2(1 To UBound(arr2) - 1)
                End If
                times = Empty
            End If
        Loop
    End With
    arr3 = newcoll.keys
    If newcoll.Count = 0 Then 
             Collection = False
    Else
             Collection = arr3
End If 
End Function

Isn’t it unreadable and indigestible? The above “double Dutch” is only one step to compute the intersection set of several steps. Undoubtedly, VBA needs a great programming capability and is by no means suitable for nontechnical persons.
Then, let’s check the impressive esProc solution below.

esProc Solution


A1 and A6: Retrieve the “Client Report” of a certain region respectively and “Top 500 list”. Please note that “rangeFile” is a parameter, and you can assign various file names to get various results. In addition, the “percent” in the B2 is also a parameter, for example, 10%, 20%, and 30%.
A2: Sort the data in A1 by sales value. The ”amount” is column name retrieved automatically, and the ”-1” represents the descending order.
B2: Compute the row number of clients ranking the top 10%, 20% or 30% respectively.
A3: Compute the clients from row 1 to B2 that are all big clients. Assume that B2 equals to 3, then “to(B2)” equals to ”1,2,3”.
A4: Compute the average sales value of big clients
A7: Compute the clients which not only big clients but also among the Top 500. In other words, this is to compute the intersection set of the customer column from the Client Report and the 500Name column from the Top 500. The ”^” represents the intersecting action.
A8: Compute the number of clients in the intersection set from the previous step.
As we can see, the style of esProc expression is similar to that of Excel®, agile and intuitive but more powerful in computing and capable to rerun just as a program does. It is a great analysis tool to empower the nontechnical persons who are familiar the style of Excel®.
Perfect! esProc is just the best tool to solve such problems.
II Features Fit for Excel
Better Usability
esProc provides an operation interface of “cellset” style with the letter as column name and number as row no. The cells can be mutually referenced with cell name. Such style is quite friendly to people who are familiar with Excel.
The cellset allows the business analyst to work from the business perspective, process and analyze the data intuitively. Therefore, esProc demands little on technical capability from users, and thus ideal for business person with no technical background.
esProc can be installed on the normal PC with common OS , and run in a environment similar to that of Excel.

Strong Analysis Ability
As a tool specially designed to handle massive data computations, esProc has all capability of SQL statements and senior languages. On one hand, esProc can be used to query, filter, group, and collect statistics, just like SQL statements; On the other hand, it can be used in the loop and branch judgment for the procedure analysis, just like VBA.
In the practical use, esProc over-performs the SQL and senior languages, thanks should go to the below advantages: esProc users will never face the dilemma of lengthy and unreadable SQL statements and the poor computability of senior languages. Even the nontechnical person can also resort to esProc to complete the complex analysis computation all by themselves.

Programmed Running Mode
esProc has special optimizations for Excel, providing the easy-to-use functions for reading from or writing back to Excel spreadsheets of various versions from Excel 97 to Excel 2007.
In a programmed running mode, esProc users can analyze various Excel spreadsheets according to various parameters, which is ideal for the repetitive computation. It is indeed a timesaving and effort-saving analysis tool.

III Significance and Value to Excel
esProc is a powerful analysis tool for Excel, and particularly suits the need of nontechnical persons to implement complex computational analysis on data from Excel spreadsheets.

esProc facilitates the data mining on Excel with the convenience and power for all people to deliver and ensure the valuable data will truly support the decision-making of enterprises.

esProc saves the long-stored Excel from turning into a legacy over time. esProc will tap the utmost value of Excel.