显示标签为“group”的博文。显示所有博文

2014年9月17日星期三

Using SQL in esProc (II)

5 .Comparison between common SQL statements and esProc syntax

1)  Select * from

Query results are as follows:

2) Select … from 

Get designated fields from the table. Both A2 and A3 have the same query results as follows:
3) As 

Compute FULLNAME according to NAME and SURNAME, and meanwhile, compute AGE according to BIRTHDAY. Basically, both A2 and A3 have the same query results as follows:
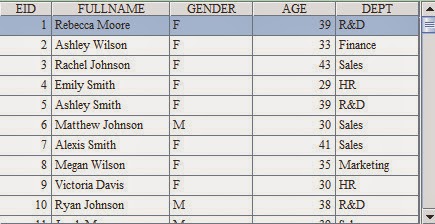
Note that AGE is computed in A3 by subtracting years and exact computations will be more complicated since SQL hasn't functions to directly compute age.

4)  Where 

Query employees who are younger than 30 years old, then compute in esProc using existed results. Query results of A3 are as follows:

Query the same results in A4 with SQL but the syntax is much more complicated. As the process of computing age is inexact, errors occur in the results.

5) Count, sum, avg, max and min 

Query the total number of employees who are younger than 30 years old, compute in esProc using existed results. Query result of A3 is as follows:
This time, A4 uses a more exact method to compute AGE and gets a query result that is consistent with that of A3. But it cannot use the existed results and statements are more complicated.

The usage of SQL functions, such as sum, avg, max and min, is similar to that of count

6) Distinct

Query which departments does the employee information come from.Both A2 and A3 have the same results. Query results are as follows:
7) Order by 

Query employees who are younger than 30 years old, sort them by age in descending order; meanwhile, sort employees of the same age by fullname in ascending order. Both A3 and A4 have the same query results as follows:

Since it is complicated to compute age with SQL and existed results cannot be used, this time A4 simplifies statements with nested query. However, the process is still complex.

8) Andornot and < > 

Query employees who are younger than 30 years old and whose initials of full names are S. Results are as follows:

It can be seen that and is represented in esProc by the operator && and two equal signs == are used to judge whether things are equal or not. These are in line with the customs of many program languages. Similarly, in esProc, or is represented by the operator "||", not by"!", and<>by"!=".

9)  Like 

Query fullnames of employees whose names are ended by a. Query results are as follows:

In using like function, different databases use different wildcard characters. In this example, for instance, percent "%" is used to represent zero or multiple arbitrary characters; while in some other databases, asterisk "*" is used to represent the same things. But with esProc, syntax of any database is the same.

10) Group 

If grouping by departments employees work for, group function can be used in esProc to group records as follows:

It can be seen that the result of grouping with esProc is that records are divided into multiple groups. These groups can be used to perform further computations as required in esProc.

A3 directly computes grouping and summarizing with esProc function while A4 does the job with SQL. They get the same results. SQL doesn’t have the real "group" concept, so it can only perform aggregate computations in query by groups. Results are as follows: 

2014年9月4日星期四

Methods of Grouping and Summarizing in R Language

The operation of grouping and summarizing includes grouping one or more certain fields of two-dimensional structured data and then summarizing fields of each group. The following will introduce methods of grouping and summarizing in R language through an example. In order to make the example more typical, we’ll set two fields to be grouped and two summarizing operations.

Case description:
Please group data frame orders according to CLIENT and SELLERID, and then summate field AMOUNT and seek its maximum value respectively in each group.

Note: orders contains records of sales orders. Its source can be a database or a file. Such as orders<-read.table("sales.txt",sep="\t", header=TRUE).The first rows of data are as follows: 

Method 1: aggregate function
Code:
   result1<-aggregate(orders$AMOUNT, orders[,c("SELLERID","CLIENT")],sum)
   result2<-aggregate(orders$AMOUNT, orders[,c("SELLERID","CLIENT")],max)
   result<-cbind(result1,result2$x)

Part of the computed result:

Code interpretation:
1. The name aggregate implies that it is a function specializing in grouping and summarizing. Both its input parameters and computed result are data frame and its usage is relatively simple.
2. aggregate function cannot perform multiple summarizing operations on grouped data, thus two lines of code are required to realize the operations of seeking sum and max respectively, then their results are combined using cbind. Obviously, the code is not satisfactory in performance and usability.
3. aggregate function has a strange requirement about the order of the fields to be grouped, that is, the fields must be in reversed order. In view of this, the code for grouping CLIENT first and then SELLERID should only be written as orders[,c("SELLERID","CLIENT")]. The code written according to the normal way of thinking will be incorrect instead.
4. Not only the code is written in an unnatural way, but the computed result is weird too by putting filed SELLERID before CLIENT. In reality, the code should be improved in order to make the computed result conform to the business logic.

Summary:
aggregate function manages to perform the task after a fashion. But it is not good in performance and usability because the way of coding, computed result and business logic are inconsistent with each other.


Code:
   result1<-lapply(sp,FUN=function(x) sum(x$AMOUNT))
   result2<-lapply(sp,FUN=function(x) max(x$AMOUNT))
   result<-cbind(result1,result2)

Part of the computed result:

Code interpretation:
1.The role of split function is to group the data frame according to specified fields. No further computation is involved. lapply function can perform the same operation on data of each group. By working with each other, split and lapply can fulfill the task.
2. Because the grouped data can be reused, this operation performs better than that using aggregate function.
3. As lapply function doesn't support multiple statistical approaches, two lines of code are required too to realize the operations of seeking sum and max respectively, and then use cbind to combine the results. What’s more, this operation requires an extra split function, so instead of enhancing the usability, it reduces it.
4. The grouping order is still unnatural and the code has to be written reversely as orders[,c("SELLERID","CLIENT")].
5.  The computed result needs a lot of modification which brings great inconvenience. It can be seen that the first column of the computed result is, in fact, the "SELLERID.CLIENT"”. The column needs to be split into two columns whose orders should be exchanged.

Summary:

This operation improves some performance but the usability is obviously poor with inconsistency in the aspects of way of coding, business logic and the computed result.

lapply belongs to the family of apply function. Similar functions include sapply and tapply, whose usages differ on parameters. For example:

   sp<-split(orders,orders[,c("SELLERID","CLIENT")],drop=TRUE)
   result1<-sapply(sp,simplify=FALSE,FUN=function(x) sum(x$AMOUNT))
   result2<-sapply(sp,simplify=FALSE,FUN=function(x) max(x$AMOUNT))
   result<-cbind(result1,result2)

tapply specializes in data frame, which, by rights, is the most suitable one for fulfilling this task. But it isn't in fact. It applies only to the situation where a single field is required to be grouped. When it is used to group two fields together, the result will be two-dimensional matrix. This requires users to make further complicated processing. For example, the computed result of the line of code tapply(orders$AMOUNT, orders[,c("SELLERID","CLIENT")],function(x) sum(x))is as follows:

Third-party library functions

There are various disadvantages when using R's built-in functions to group and summarize. In response to the problem, we may consider using the third-party library functions, such as reshape, stack, etc. The stability and computational efficiency of these library functions is generally not as good as those of the built-in functions, and the information for their use is not many. Therefore it is difficult for them to fulfill the task. Here we won't go into any example about their use.

Third-party languages
Python, esProc and Perl can also be employed to fulfill this task. All of them can perform grouping and summarizing as well as structured data computing as R language can. We’ll briefly introduce solutions of esProc and python.

esProc
esProc can fulfill this task by simply using groups function. Its syntax is concise and easy to understand, as well as in line with the natural way of thinking. The code is as follows:   

  result=orders.groups(CLIENT,SELLERID;sum(Amount),max(Amount))

The computed result, syntax and business logic are highly consistent with each other in esProc. Some of the computed results are as follows:

Python(pandas)
If python's built-in functions are used to deal with this task, the code will be rather complicated. Here pandas, the third-party function library, comes to help. pandas will first perform grouping operation using groupby function, then summarize using agg function. Its code, which is simpler than R language but not as good as esProc,is written like this:   

   result=orders.groupby(['CLIENT','SELLERID']).agg({'AMOUNT':[sum,max]}).

Pandas' computed result and syntax are highly consistent with the business logic. Part of the computed result is as follows:


The step-by-step computational mode of grouping first then summarizing adopted by pandas is not always bad. Such as, it can increase performance in situations where grouping result is reused. esProc can also perform the step-by-step operation, the equivalent code is group(CLIENT,SELLERID).new(CLIENT,SELLERID,sum(AMOUNT),max(AMOUNT)).

2014年8月17日星期日

A Handy Method of Grouping and Summarizing Text File Data in Java

We often need to process text file data while programming. Here is an example for illustrating how to group and summarize text file data in Java: load employee information from text file employee.txt, group according to DEPT and seek COUNT, the number of employee, and total amount of SALARY of each group.

Text file employee.txt is in a format as follows:
EID   NAME       SURNAME        GENDER  STATE        BIRTHDAY        HIREDATE         DEPT         SALARY
1       Rebecca   Moore      F       California 1974-11-20       2005-03-11       R&D          7000
2       Ashley      Wilson      F       New York 1980-07-19       2008-03-16       Finance    11000
3       Rachel      Johnson   F       New Mexico     1970-12-17       2010-12-01       Sales         9000
4       Emily         Smith        F       Texas        1985-03-07       2006-08-15       HR    7000
5       Ashley      Smith        F       Texas        1975-05-13       2004-07-30       R&D          16000
6       Matthew Johnson   M     California 1984-07-07       2005-07-07       Sales         11000
7       Alexis        Smith        F       Illinois       1972-08-16       2002-08-16       Sales         9000
8       Megan     Wilson      F       California 1979-04-19       1984-04-19       Marketing        11000
9       Victoria    Davis        F       Texas        1983-12-07       2009-12-07       HR    3000
10     Ryan         Johnson   M     Pennsylvania    1976-03-12       2006-03-12       R&D          13000
11     Jacob        Moore      M     Texas        1974-12-16       2004-12-16       Sales         12000
12     Jessica     Davis        F       New York 1980-09-11       2008-09-11       Sales         7000
13     Daniel       Davis        M     Florida      1982-05-14       2010-05-14       Finance    10000

Java's way of writing code for this task is:
1.Import data from the file by rows and save them in emp, the multiple Map objects of sourceList, the List object.
2.Traverse the object of sourceList, perform grouping according to DEPT and save the result in list, which contains different List objects of group, the Map object.
3.Traverse group and then traverse each DEPT’s list object, and sum up SALARY.
4.While traversing group, save the values of DEPT, COUNT and SALARY in result, the Map object, and the results of different departments in resultList, the List object.
5.Print out the data of resultList.

The code is as follows:
public static void myGroup() throws Exception{
           File file = new File("D:\\esProc\\employee.txt");
           FileInputStream fis = null;
           fis = new FileInputStream(file);
           InputStreamReader input = new InputStreamReader(fis);
           BufferedReader br = new BufferedReader(input);
           String line = null;
           String info[] = null;
           List<Map<String,String>> sourceList= new ArrayList<Map<String,String>>();
           List<Map<String,Object>> resultList= new ArrayList<Map<String,Object>>();
           if ((line = br.readLine())== null) return;//skip the first row
           while((line = br.readLine())!= null){
                    info = line.split("\t");
                    Map<String,String> emp=new HashMap<String,String>();
                    emp.put("EID",info[0]);
                    emp.put("NAME",info[1]);
                    emp.put("SURNAME",info[2]);
                    emp.put("GENDER",info[3]);
                    emp.put("STATE",info[4]);
                    emp.put("BIRTHDAY",info[5]);
                    emp.put("HIREDATE",info[6]);
                    emp.put("DEPT",info[7]);
                    emp.put("SALARY",info[8]);
                    sourceList.add(emp);
           }
           Map<String,List<Map<String,String>>> group = new HashMap<String,List<Map<String,String>>>();
           //grouping object
           for (int i = 0, len = sourceList.size(); i < len; i++) {//group datafrom different DEPT
                    Map<String,String> emp =(Map) sourceList.get(i); 
            if(group.containsKey(emp.get("DEPT"))) {
                group.get(emp.get("DEPT")).add(emp) ;
            } else {
                List<Map<String,String>> list = new ArrayList<Map<String,String>>() ;
                list.add(emp) ;
                group.put(emp.get("DEPT"),list) ;
            }
           }
           Set<String> key = group.keySet();
           for (Iterator it = key.iterator(); it.hasNext();) {//summarize the grouped data                     
String dept = (String) it.next();
                    List<Map<String,String>> list = group.get(dept);
                    double salary =0;
                    for (int i = 0, len = list.size(); i < len; i++) {
                             salary += Float.parseFloat(list.get(i).get("SALARY"));
                    }
                    Map<String,Object> result=new HashMap<String,Object>();
                    result.put("DEPT",dept);
                    result.put("SALARY",salary);
                    result.put("COUNT",list.size());
                    resultList.add(result);
           }
           for (int i = 0, len = resultList.size(); i < len; i++) {//print out the resulting data
                    System.out.println("dept="+resultList.get(i).get("DEPT")+
                                       "||salary="+resultList.get(i).get("SALARY")+
                                       "||count="+resultList.get(i).get("COUNT"));
           }
}

The results after the code is executed are as follows:

    dept=Sales||salary=1362500.0||count=187
    dept=Finance||salary=177500.0||count=24
    dept=Administration||salary=40000.0||count=4
    dept=Production||salary=663000.0||count=91
    dept=Marketing||salary=733500.0||count=99

Here myGroup function has only one grouping field. If it has multiple grouping fields, nested multi-layer collections class is needed and the code will become more complicated. As myGroup function has fixed grouping fields and summarizing fields, if there is any change about the fields, we have no choice but to modify the program. This robsthe function of the ability to deal with situations of flexible and dynamic grouping and summarizing. In order to enable it to handle these situations as well as SQL statement does, we need to develop additional program for analyzing and evaluating dynamic expressions, which is a rather difficult job.

As a programming language specially designed for processing structured (semi-structured) data and able to perform dynamic grouping and summarizing easily, esProc can rise to the occasion at this time as a better assistive tool. It can integrate with Java seamlessly, enabling Java to access and process text file data as dynamically as SQL does.

For example, group according to DEPT and seek COUNT, the number of employees, and the total amount of SALARY of each group. To do this, esProc can import from external an input parameter "groupBy" as the condition of dynamic grouping and summarizing. See the following chart:

The value of “groupBy” is DEPT:dept;count(~):count,sum(SALARY):salary. esProc needs only three lines of code as follows to do this job: 

A1Define a file object and import the data to it. The first row is the headline which uses tab as the default field separator. esProc’s IDE can display the imported data visually, like the right part of the above chart.
A2Group and summarize according to the specified field. Here macro is used to dynamically analyze the expression in which groupBy is an input parameter. esProc will first compute the expression enclosed by ${…}, then replace ${…} with the computed result acting as the macro string value and interpret and execute the result. In this example, the code we finally execute is =A1.groups(DEPT:dept;count(~):count,sum(SALARY):salary).
A3Return the eligible result set to the external program.

When the grouping field is changed, it is no need to change the program. We just need to change the parameter groupBy. For example, group according to the two fields DEPT and GENDER and seek COUNT, the number of employees, and the total amount of SALARY of each group. The value of parameter groupBy can be expressed like this: DEPT:dept,GENDER:gender;count(~):count,sum(SALARY):salary. After execution, the result set in A2 is as follows: 
Finally, call this piece of esProc code in Java to get the grouping and summarizing result byusing JDBCprovided by esProc. The code called by Java for saving the above esProc code as test.dfx file is as follows:
  // create esProc jdbc connection
Class.forName("com.esproc.jdbc.InternalDriver");
con= DriverManager.getConnection("jdbc:esproc:local://");
//call esProc code (the stored procedure) in which test is the file name of dfx
com.esproc.jdbc.InternalCStatement st;
st =(com.esproc.jdbc.InternalCStatement)con.prepareCall("call test(?)");
// set parameters
st.setObject(1,"DEPT:dept,GENDER:gender;count(~):count,sum(SALARY):salary");//the parameters are the dynamic grouping and summarizing fields
// execute the esProc stored procedure
st.execute();
// get the result set
ResultSet set = st.getResultSet();

Here the relatively simple esProc code can be called directly by Java, so it is unnecessary to write esProc script file (like the above test.dfx). The code is as follows:
st=(com. esproc.jdbc.InternalCStatement)con.createStatement();
          ResultSet set=st.executeQuery("=file(\"D:\\\\esProc\\\\employee.txt\").import@t().groups(DEPT:dept,GENDER:gender;count(~):count,sum(SALARY):salary)");

The above Java code directly calls a line of code from esProc script: get data from the text file, group and summarize them according to the specified fields and return the result toset, Java's ResultSet object.

2014年8月12日星期二

Code Examples of Common In-Memory Grouping with esProc

It is convenient to realize some common in-memory grouping with esProc, such as, equal grouping, alignment grouping and enumeration grouping. They are to be illustrated with the following examples.

Equal grouping

Grouping basis of equal grouping is certain fields (or computed columns derived from fields) within a data set. Each group is a subset of original data set.
Case description: Group sales orders by the year.

Data description: Data of sales orders are shown below: 
The above data set (table sequence) can be accessed from a database or a file. For example:
A1=file("E:/sales.txt").import@t()
esProc code:
    A2=A1.group(year(OrderDate))
Computed results:
Code interpretation:
1. In this example, grouping basis comes from OrderDate. The date of sales order will be converted into the year through year(OrderDate), and data of the same year will be grouped together.
2.There may be multiple fields for grouping. For example, regroup data of different years and sellers according to year and sellers. The code is:
A1.group(year(OrderDate),SellerId)
3.Often, the grouped data are used to perform aggregation operations, such as, compute each year’s sales amount according to A2. The code is:
A2.new(year(OrderDate):y,~.sum(Amount):a)
   Computed results are:
Or, combine grouping and summarizing into one step with groups function:
A1.groups(year(OrderDate):y; sum(Amount):a)

Of course, sometimes we have to execute grouping and summarizing separately in order to reuse the code and improve computational efficiency. For example, filter one of the groups of A2, and perform association computation for another group. Another situation is that, if, after summarizing, data of a certain group are unusual and worth further study, then this group can be used directly to go on with the computations. It’s no need to filter the group again.  

4. By default, esProc's group function will group data by using hash algorithm. But, comparing adjacent rows can have higher performance for ordered data. This can be executed by using option @o in group function. For example:
A1.group@o(year(OrderDate),SellerId)

Alignment grouping

Criterions used for equal grouping come from within a dataset. But sometimes, they originate from without, like fields of other data sets, arrays created by users, parameter list and so on. Thus the alignment grouping comes into being.

Different from equal grouping, method of alignment grouping may produce empty subsets, which have no members to correspond to data of a group. It may also produce incomplete groups, meaning that some data won't be included in any group. These things won't happen for equal grouping.  Case description: Table of top 10 sellers has been worked out in the light of performance, please group sales orders according to the table order.

The data set before grouping:
The sales orders are the same as those in above example. Data are stored in A1.
Table of the top 10 sellers is stored in B1 as follows: 

Sellers table may come from a temporary table, or be generated by a piece of code. The generating process is not the focus of this example.
esProc code:
    A1.align@a(B1:empID,SellerId)

Computed results:
Code interpretation:
1. In this example, the grouping basis (sellers table) comes from without the data set to be grouped. After grouping is completed, a group contains only the data of one seller, and groups are sorted according to sellers table. 
2. Because sellers in sales orders outnumber those in sellers table, some of the orders won’t appear in any groups. If we want to create one more group to store these orders, we can use function option @n as follows:
A1.align@a@n(B1:empID,SellerId)
    The one more group will be put last as follows: 

3. Sometimes, the grouping basis is not within the data set to be grouped, such as, “newly-employed sellers table”. In this case, it’s normal to produce empty groups. Modify the first group of data in the table into empID=100, for example, the computed results will be: 

Enumeration grouping 

The grouping basis for enumeration grouping could be more flexible. It could be any Boolean expressions. Those records consistent with the expression will get into the same group. Similar to alignment grouping, enumeration grouping is also of incomplete grouping, probably producing empty subsets or results that some records are not included in any group. In addition, with this grouping method, it is likely that some records may appear in more than one group.  Case description: Divide sales orders into four groups, they are: A. order amount is less than 1000; B. order amount is less than 2000; C. order amount is less than 3000; D. order amount is less than 10,000. Note that the data cannot be grouped repeatedly, that is, if an order has been in group A, it must not be put into group B, C, or D.
The data set before grouping:
The sales orders are the same as those in above example. Data are stored in A1.
esProc code:
    A2=["?<=1000","?<=2000","?<=3000","?<=10000"]
    A3=A1.enum(A2,Amount)
Computed results:
Case interpretation:
1.In this example, grouping basis for grouping is multiple flexible expressions. Each record will be compared with the expressions. Those consistent with the same expression will be put into the same group. Groups are sorted according to order of grouping basis as well.

2.By default, enumeration grouping will not produce identical results. The method, which is showed in the above example, is that after group A’s data are selected, the rest of data will be compared with expression B to see their consistency. While the use of function option @r, which represents that all data are compared with expression B, may produce identical results. For example: A3=A1.enum@r(A2,Amount), computed results are: 

3. Similar to alignment grouping, if the expression for enumeration grouping is inconsistent with any data to be grouped, empty group will appear. Besides, if some data are inconsistent with any expression, function option @n can be used to put them into a surplus group.